Richard Linklater's 1991 film "Slacker" touches on a number of persistent conspiracy theories. Many of them, such as moon landing hoaxes and JFK assassination plots, are still bandied about today, especially on late-night talk shows like Coast to Coast AM. If you watch this clip, you'll see an example, but there's a part about global warming, too. Today the conspiracy nuts think that global warming is the hoax, that somehow scientists are pulling the wool over the eyes of the public. This clip shows that around 1990, the conspiracy needle was really pointing the other way, with the government covering up global warming. "Greenhouse effect... by the way, they discovered that in the '40s."
Showing posts with label fun. Show all posts
Showing posts with label fun. Show all posts
2011-02-17

2010-10-15
fancy words
Okay, no peeking, is this a real or fake title for a paper (answer below):
Enhanced ocean temperature forecast skills through 3-D super-ensemble multi-model fusion
Yep, totally real, I just saw it in my GRL RSS feed. Here's the rest:
F. Lenartz, B. Mourre, A. Barth, J.-M. Beckers, L. Vandenbulcke and M. Rixen
Enhanced ocean temperature forecast skills through 3-D super-ensemble multi-model fusion
Yep, totally real, I just saw it in my GRL RSS feed. Here's the rest:
F. Lenartz, B. Mourre, A. Barth, J.-M. Beckers, L. Vandenbulcke and M. Rixen
An innovative multi-model fusion technique is proposed to improve short-term ocean temperature forecasts: the three-dimensional super-ensemble. In this method, a Kalman Filter is used to adjust three-dimensional model weights over a past learning period, allowing to give more importance to recent observations, and take into account spatially varying model skills. The predictive performance is evaluated against SST analyses, CTD casts and gliders tracks collected during the Ligurian Sea Cal/Val 2008 experiment. Statistical results not only show a very significant bias reduction of this multi-model forecast in comparison with the individual models, their ensemble mean and a single-weight-per-model version of the super-ensemble, but also the improvement of other pattern-related skills. In a 48-h forecast experiment, and with respect to the ensemble mean, surface and subsurface root-mean-square differences with observations are reduced by 57% and 35% respectively, making this new technique a suitable non-intrusive post-processing method for multi-model operational forecasting systems.
2010-10-11
The Simpson's & Banksy collaborate
In the absence of actual content, I submit entertainment:
Banksy storyboarded the sequence. Via Laughing Squid via Daring Fireball.
Banksy storyboarded the sequence. Via Laughing Squid via Daring Fireball.
2010-06-11
A word about titles
Most scientific papers have terrible titles. Sometimes they are descriptive, often too descriptive. It's nice to see short titles, especially when they don't sound pretentious. It's even better when the title is short and clever, and that hardly ever happens. It happens so rarely, that I hardly look at titles. Today I realized that a paper I've read probably 5 times over the years, has one of the best titles ever:
THE EPIC 2001 STRATOCUMULUS STUDY
I put it in all caps because that's how they did it in the print version [LINK].
I've heard so much about EPIC, which stands for Eastern Pacific Investigation of Climate, that I never realized that the title of the paper is a play on words! I'm now pretty convinced that the field project was named EPIC just to have that title.
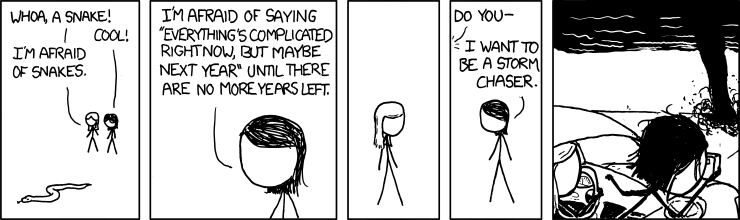
2010-04-18
2010-01-20
2010-01-13
The Dolphin Situation
It seems that dolphins may be "non-human persons," and deserves special rights above other animals [LINK]. Maybe we can just have the dolphins figure out a way to suck the CO2 out of the atmosphere and avoid making their own underwater world an acid bath. Go Dolphins!
2010-01-11
Coolest thing I've seen all day
If you can, watch in full screen with HD for full effect:
A related comic version: http://xkcd.com/482/
A related comic version: http://xkcd.com/482/
2009-12-17
2009-12-11
Friday means a comic (2)

2009-11-12
NCAR YouTube Channel
Well, I just learned that NCAR has a whole bunch of videos posted on YouTube: http://www.youtube.com/ncarucar. These are videos about the research done at NCAR (and UCAR), basically aimed at the general public. Non-experts will probably gain some insight into climate science, while those of us in the field can look for people we know. Enjoy.
2009-10-16
Woo-hoo for me

Well, I took the Pew Research Center's science knowledge quiz, and as you can see, I did quite well. Go take the quiz yourself: LINK.
2009-08-05
Nissan Leaf
I've never really wanted a Nissan before, but this looks pretty sweet: the Nissan Leaf, an all-electric hatchback.
[News]
[News]
2009-08-03
2009-08-02
The funny guy makes a good point
Here is Dara O'Brian saying things more convincingly than most more serious folks:
This video was drawn to my attention by Phil Plait's blog.
This video was drawn to my attention by Phil Plait's blog.
2009-07-26
Should we prepare for the singularity?
The singularity is the hypothesized moment when artificial intelligence becomes as intelligent as humans. At that point, machines might have the ability to decide to make smarter machines, which will make smarter machines, ad infinitum, relegating humans to a subservient role in society. Another view of the singularity is that it will free humanity from the shackles of the material world, allowing unimaginable lifespan and freedom to think, create, and explore. A NYTimes.com article covers a meeting of computer scientists who are starting to wonder whether limits on artificial intelligence research should be imposed [LINK].
The article makes it seem as though these scientists are concerned with current, or near-future, technologies that could disrupt society. It cites a few recent advances, especially pushing this empathy simulating robot. From my reading, none of these technologies seems very threatening, and most have much more potential for good than harm.
Thinking farther into the future, to a time when the singularity is imminent, these concerns become very relevant. I suspect the scientists are more interested in dealing with ethical issues now that will help decision making then. The fact of the matter is that the singularity, in one form or another, is imminent, and so some thought about what it means is important. Regulating research seems like a wrong-headed direction to me though, because that will mean that the singularity will sneak up on us. Everyone will be pushing their science to bump around the edges of the rules, and suddenly that surface beyond which lies advanced artificial intelligence will be gone, disintegrated, and humanity won't be properly prepared because everyone promised they weren't going to go past that boundary.
Don't get me wrong, even at the moment of the singularity, I don't think it means machines will start taking over. Simply having the capacity to be more intelligent than humans doesn't mean those initial machines will be successful at autonomous thought and decision-making... i.e., they won't really be conscious. Rather, those intelligent machines will be in increment in the machine-human interaction that will, I hope, push the boundaries of the human experience. There are possibilities to extend lifespan, expand thought capacity, stimulate creativity, and boost productivity. These are the promises of intelligent machines, but so were they the promises of digital computers and nano-bots, so we can't rely on it happening. We still don't have flying cars and jet-packs, and we still don't have nanotechnology that repairs roads and buildings or constructs moon bases for us, nor do we know whether a simulation of the human brain pushes artificial intelligence to a new level, or if very advanced computing technology will be able to interact with biological systems in any interesting ways [cf. LINK]. Despite my hope for the coming singularity, it is far from certain that we'll know when it happens or what it means, and it is unlikely, with any amount of planning, that we'll know what to do when that day comes to make the most of the technology.
2009-07-16
"Greenest" cities
Just came across NRDC's list of greenest cites, which they actually call smartest cities. I like using 'smart' here rather than 'green,' and might try to remember to use that turn of phrase in the future.
Anyway, Seattle is at the top, which isn't a surprise. Other cities near the top are San Francisco, Portland, Oakland, and San Jose. Hmmm... seeing a trend here? Kind of a western, northern kind of vibe? Hmm.
Other cities of personal interest include Sacramento at #7 (good job Sac-town!), Denver at #9, and LA at #13. That's a pretty impressive ranking for LA considering the size of the place (and environmental problems that aren't going away any time soon).
Fort Collins is #3 on the medium-sized cities. They somehow get a good grade for transportation, though I'm totally baffled as to how that happened. Berkeley came in at a disappointing #11 in medium-sized cities. It might be because they rely on Alameda county and other regional resources, but that's just a guess.
Boulder is a small city (barely), and comes in at #2 for green building, but is just #56 overall. It's behind Santa Fe! This is quite a turn of events... what is going on Boulder???
So, go look for your favorite cities, the website is very nice: SmarterCities
2009-06-03
CoolIris
Holy moly... http://www.cooliris.com
Having just installed this "simple browser plugin" a mere 10 minutes ago, I am wholeheartedly endorsing it and pleading with you to go and install it.
I can't even try to describe it, except to say that it is paradigm changing for me.
2009-05-31
ClimateWizard.org: A web resource?

Having just ready this brief article [LINK] about a new web site called ClimateWizard.org, I was skeptical of its usefulness. Essentially, this is a web application that just makes reasonably nice map representations of some climate model runs (from the last IPCC report) guided by user input. The input is limited to what geographic region to map, which admittedly is the only way most people think to look at these kinds of simulations. The user can choose the USA and zoom in on specific states, or can choose "global" and choose individual countries and territories. Not everything seems to work (e.g., Guam doesn't show any data), but most of the buttons I clicked generated maps. The user also gets to choose a specific month, or annual average, and can plot the average or change in surface temperature or precipitation either for the past 50 years, the projections at 2050, or (for the USA) projections for 2100. As of writing this, the choices also including picking one of three models or the model average. It is unclear what exactly is being plotted for the past 50 years, the documentation indicates it is a combined observational data set, but there are two curves in a small timeseries plot that are not obviously explained(figure). All in all, it is a fun little application, though not the grandiose life-altering tool that the news article seems to suggest.
Now, a little criticism to go along with the overview. There are definitely really good things about this application, including using Google Maps as the underlying mapping framework. This is nice because it works well, looks good, and people know how to deal with it. That is a definite win. There are some limited download options, too, which is good so that people (especially students??) can just grab the image and put it into a document. They can also get the data in GIS format, which is good for some small set of people who know what to do with that. It would be nice to expand that to include some other common data formats, like HDF or netCDF. Of course, that would be mostly helpful to more experienced users, which gets to another point. This application, as a framework for quickly looking at data and downloading a small subset of it, seems like it could be really useful for all kinds of people, from policy makers to serious scientists, and back to students (and grad students) and teachers (and college profs). In its current state, it's a toy though. The limitation to these three models is curious, since the data from 20+ models should be readily available, and the limitation to surface temperature and precipitation are arbitrary. Yes, that is what most people will be interested in, but having an advanced tab and then having a lot more variables would be great. For example, maybe a high school or college student is doing a report on climate feedbacks, and wants to see how cloud fraction changes in the models. It's a trivial thing to add to this app, but its absence means the student will have to rely on secondhand information or be much more industrious. My other criticism is that the color choices for the contour maps are not that good. It's the standard blue-to-green-to-yellow-to-red rainbow. It works reasonably well for surface temperature and less well for precipitation. The real problem is that they apply it to the changes, which for most places are small making them light yellow or greenish. It's especially apparent in the precipitation, where it is often difficult to even discern the sign of the change.
Okay, one more important criticism. These global models do a poor job in representing regional climate, and there is little evidence that they accurately predict changes in regional climate to the level that this application implies. You can, for example, zoom in on Haiti and see that the model average temperature change at 2050 is about 1C (except for some whitish points that don't make sense on the color scale). But these are about 15 grid points, which are not the native grid points from the model, which have fraction amounts of land and almost no representation of the topography of Haiti. What I'm saying is that you can't trust a few points from one (or three) models to give an accurate portrayal of climate change unless you can verify the fidelity of the models at those points using observations and have an understanding of the limitations of the modeling framework. Looking at the past 50 years is helpful to ascertain some sense of the models' ability in the region, but as mentioned above, it isn't even clear what is being plotted for that in the application. If the blue line is the models and the black line is the observations, then the correlation is generally pretty poor for Haiti, right, but the trend is pretty decent, it's just that the average of the models doesn't have much variability (unless it is the other way around, or if the blue line is one of the models instead of the ensemble... but these are not explained).
So, overall, I like ClimateWizard.org, but I think there is a lot of room for improvement, both for the present purposes and for future expansions to more serious data exploration.
Subscribe to:
Posts (Atom)